Report Overview
This report analyzes the global Solar Thermal (Concentrated Solar Power, “CSP”) market over the period 2015–2032, with 2024 as the base year. It defines Solar Thermal (CSP) as utility-scale systems that convert direct normal irradiance into dispatchable electricity via concentrating optics, a thermal conversion and storage block, and a power block, covering four technology families: parabolic trough, solar power tower, linear Fresnel reflector, and parabolic dish / dish-Stirling systems.
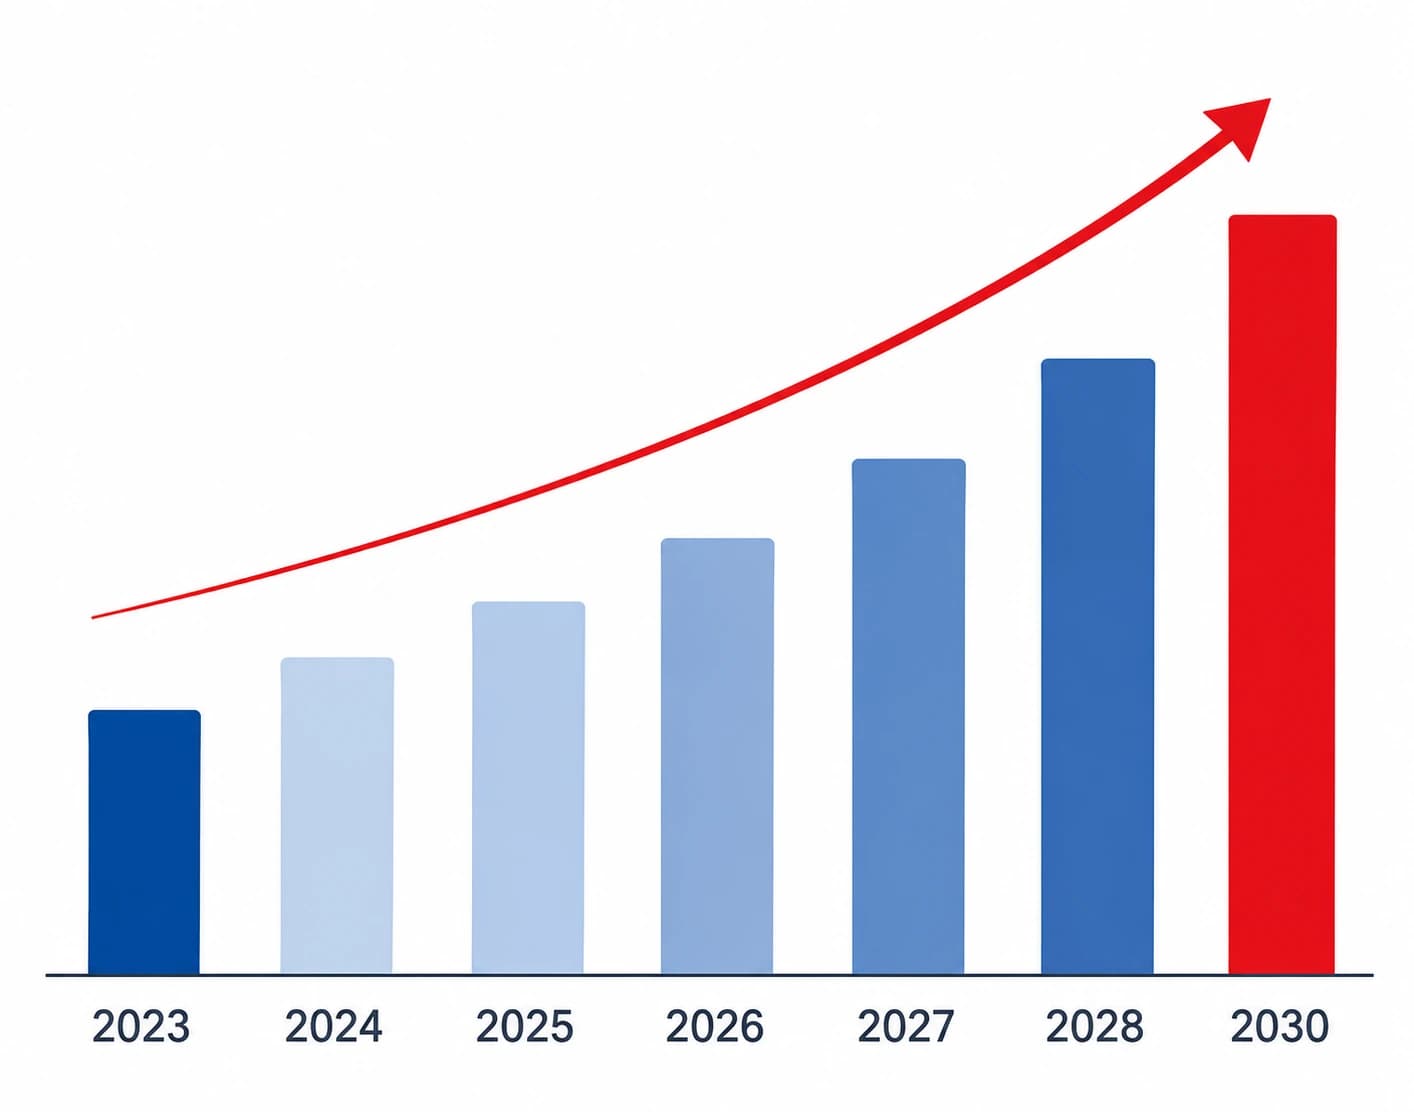
In value terms, the global Solar Thermal (CSP) market is estimated at about US$1.27 billion in 2024 and is projected to reach roughly US$11.65 billion by 2032. This implies a robust compound annual growth rate of around 24% over 2015–2032, with a particularly strong upswing from 2020 to 2024 (35% CAGR) and a step-change year in 2025 when market value is expected to double versus 2024.
On the volume side, global installed and delivered Solar Thermal (CSP) capacity is assessed at approximately 1,267 MW in 2024, rising to about 11,649 MW by 2032, reflecting high-teens to mid-twenties growth rates in the main forecast window.
Historically, CSP deployment has followed a boom-and-pause pattern. Early build-out in markets such as North America, MENA, Spain and South Africa drove global revenues to peaks around 2015–2019, followed by a pronounced dip in 2020 as several policy windows closed and new auction designs favored PV and wind.
The current cycle is characterized by a renewed focus on dispatchability and long-duration storage, with growth anchored in China and, over the forecast horizon, a visible pipeline in MENA, parts of Latin America, North America, Sub-Saharan Africa and selected APeC markets. China already accounts for the bulk of 2020–2025 market value growth, with revenue rising from roughly US$384 million in 2020 to about US$739 million in 2024 and over US$2.5 billion in 2025, before approaching US$7.8 billion by 2032.
Technologically, the market continues to transition from trough-dominated fleets toward tower-centric portfolios. While parabolic trough plants still represent a large share of the cumulative installed base, forecast market value is increasingly concentrated in power tower projects with integrated molten-salt thermal energy storage. By 2027–2032, tower systems are expected to account for roughly three-quarters or more of annual sales value, with parabolic troughs declining to a high-single-digit share, linear Fresnel systems occupying a stable niche in the low-teens, and dish-engine configurations remaining a very small fraction of the market.
This evolution reflects the higher temperature, higher storage density and stronger system-value proposition of tower designs where grids require multi-hour or overnight shifting.
Regionally, the report provides detailed revenue, volume and growth metrics for China, Europe, North America, MENA, South America, Sub-Saharan Africa and APeC. It traces the shift from the first CSP wave in Spain, the United States, North Africa and South Africa toward a new cycle led by China and, in the late-2020s and early-2030s, by large hybrid tenders and industrial-decabonization projects in MENA, Latin America and other high-DNI regions. For each region, the study quantifies historical sales value (2015–2020), the recovery and pipeline phase (2021–2026) and the forecast ramp-up through 2032, including CAGR by period and the changing mix between utility-scale power generation and process-heat/industrial applications.
On the supply side, the Solar Thermal (CSP) industry remains highly concentrated. In revenue terms, the top five manufacturers account for close to the entire 2024 market (CR5 ≈ 99.8%), with a Herfindahl-Hirschman Index consistent with a highly concentrated sector.
The competitive landscape is shaped by a small group of Chinese EPCs and system integrators (notably POWERCHINA, Energy China/CEEC and Dacheng Technology), which collectively dominate recent EPC revenue, alongside established international players such as Abengoa, SENER, COBRA, ACCIONA, TSK and GE, whose role is more visible in the legacy project fleet and technology references than in near-term revenue.
The report also maps the broader value chain, from key raw-material suppliers (HTF, mirrors, receivers, turbines, heat exchangers) to project developers, EPC contractors and end-use industries.
The demand outlook is underpinned by four structural drivers: (1) the need for firm, dispatchable capacity and evening-peak coverage in PV-rich power systems; (2) industrial decarbonization of high-temperature process heat and steam for sectors such as mining, refining, chemicals, food & beverage and desalination; (3) the economic gap for long-duration storage beyond the efficient range of Li-ion BESS, where molten-salt TES can become competitive; and (4) the rise of hybrid mega-project tenders that bundle PV, CSP and batteries and optimize portfolios at system level.
Counterbalancing these drivers, the report highlights key challenges and risks: structurally higher upfront CAPEX and longer payback compared with PV+BESS, persistent bankability and performance-risk concerns, EPC execution complexity across tightly coupled subsystems, and relatively intensive O&M requirements for mirror fields, heat-transfer media and receivers.
Methodologically, the study combines bottom-up aggregation of company-level Solar Thermal (CSP) revenue, installed capacity and implied ASPs with top-down triangulation using regional project databases, policy frameworks and secondary statistics. Market size estimates are expressed at factory-gate price level, 2024 is used as the quantitative base year, and revenues and volumes for 2025–2032 are projected using a mix of scenario-based growth assumptions, Delphi inputs and cross-checks against announced project pipelines. The resulting dataset provides a consistent view of how Solar Thermal (CSP) is expected to evolve from a niche technology into a more widely used dispatchable renewable option and long-duration storage solution in high-DNI power systems and industrial clusters through 2032.
Chapter Outline
Chapter 1: Introduces the report scope of the report, global total market size (valve, volume and price). This chapter also provides the market dynamics, latest developments of the market, the driving factors and restrictive factors of the market, the challenges and risks faced by manufacturers in the industry, and the analysis of relevant policies in the industry.
Chapter 2: Detailed analysis of Solar Thermal (CSP) manufacturers competitive landscape, price, sales and revenue market share, latest development plan, merger, and acquisition information, etc.
Chapter 3: Provides the analysis of various market segments by Type, covering the market size and development potential of each market segment, to help readers find the blue ocean market in different market segments.
Chapter 4: Provides the analysis of various market segments by Application, covering the market size and development potential of each market segment, to help readers find the blue ocean market in different downstream markets.
Chapter 5: Sales, revenue of Solar Thermal (CSP) in regional level. It provides a quantitative analysis of the market size and development potential of each region and introduces the market development, future development prospects, market space, and market size of each country in the world.
Chapter 6: Provides profiles of key players, introducing the basic situation of the main companies in the market in detail, including product sales, revenue, price, gross margin, product introduction, recent development, etc.
Chapter 7: Analysis of industrial chain, including the upstream and downstream of the industry.
Chapter 8: Conclusion.
- ★ What Is The Overall Market Size And Projected Growth Rate Across Global And Regional Segments?
- ★ How Does The Market Size And Growth Outlook Vary Across Major Countries?
- ★ Which Region Or Market Sub-Segment Is Anticipated To Dominate Growth During The Forecast Period?
- ★ What Are The Primary Factors Expected To Drive Market Expansion, And What Challenges May Restrain Growth?
- ★ Which Emerging Technologies And Market Trends Are Shaping The Future Landscape?
- ★ What Are The Most Significant Opportunities Available In The Market?
- ★ Who Are The Leading Manufacturers Actively Participating In The Global Market?
- ★ Which Company Currently Holds The Largest Share Of The Market?
- ★ What Are The Potential Growth Avenues For New Entrants In The Global Market?
Market Size Overview
US$ 1.27 billion
2026US$ 11.65 billion
203224%
CAGR (2024-2032)Key Market Segmentation

By Purity Level
- 4N
- 5N
- 6N
- Others

By Application
- Semiconductor
- Display
- Solar
- Others

By End-User Industry
- Electronics
- Optoelectronics
- Photovoltaics
- Others

By Region
- North America
- Europe
- Asia Pacific
- Latin America
- Middle East & Africa
Regional Market Insights
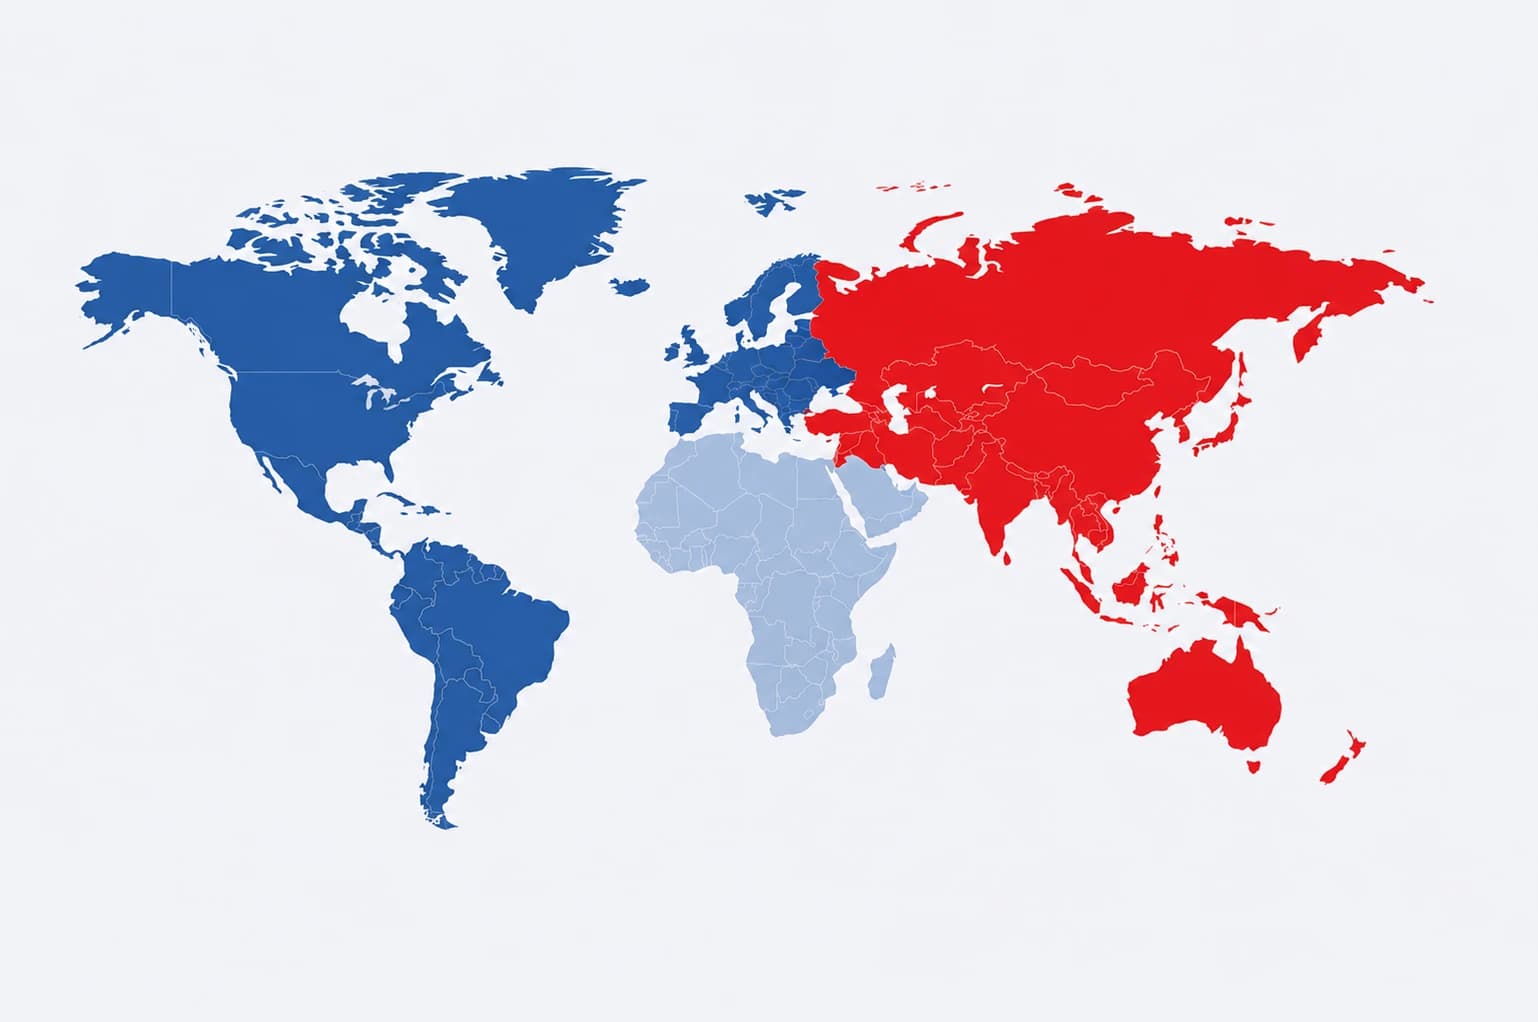

Asia Pacific
China, Japan, South Korea, Southeast Asia, India

North America
U.S., Canada, Mexico

Europe
Germany, France, UK, Italy

South America
Brazil, etc.

Middle East and Africa
Turkey, GCC Countries, Africa, etc.
Global Perspective. Local Insight.
Our reports deliver comprehensive regional coverage to help you understand market dynamics, identify growth opportunities, and make informed decisions.
Why Buy This Report?
Actionable insights. Trusted data. Smarter decisions.
Everything you need to stay ahead with confidence.
Gain a comprehensive understanding of the market
Make informed business decisions with data-backed insights
Identify growth opportunities and emerging markets
Stay ahead of competitors with actionable intelligence
Support strategic planning and investment decisions
Access detailed market segmentation and regional analysis
Benchmark key players, pricing, and market share
Benefit from reliable forecasts, trends, and future outlook
Understand customer demand, sales potential, and industry dynamics
Save research time with expert-validated data and analysis

Need Customization?
Reliable Reports
Trusted by Leaders
Global Coverage
100+ Countries
24/7 Support
We're Here to Help
Secure Payments
Safe & Trusted